Learning the FUN-damentals of Graphing
Learning the FUN-damentals of Graphing
By Mathias
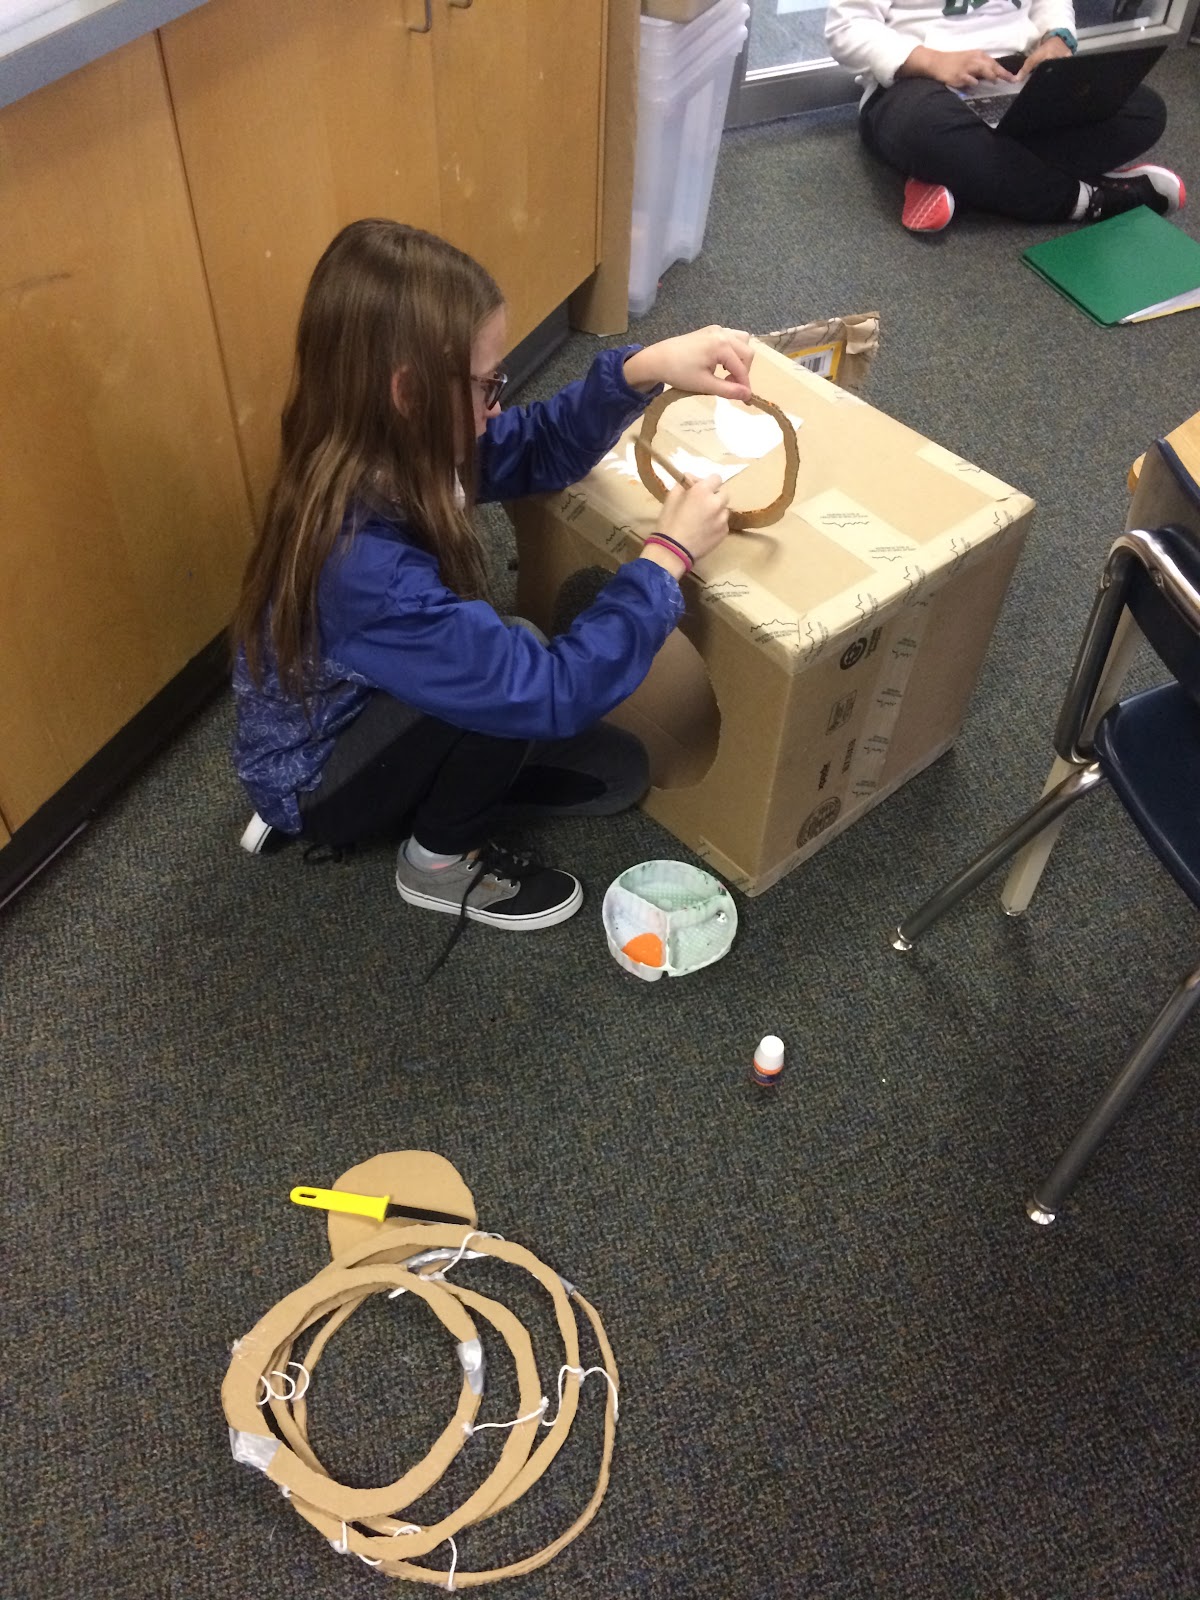
This week we conducted really fun experiments in math to practice our data collecting and graphing skills.
Here are the steps we followed to conduct our experiments in math class!
First we needed to come up with a suitable idea that could be tested. Once we had our idea we needed a good question for example my question was, "what is the most popular snack in grade 6". Some of the materials I used where crackers and vanilla yogurt! Then we had to set up a tally chart that implemented intervals. An interval is a set of numbers in between numbers like 0-5,5-11,11-16 etc... After all the writing was done we got to conduct our experiments! We had fun doing each others experiments. Then it was time to record the data we attained during our experiment and put the info into a graph.
I honestly quite enjoyed this activity and believed it was a little bit difficult for myself because it was hard to come up with a good, testable question. Next time, I think I could improve on this by coming up with a better question.
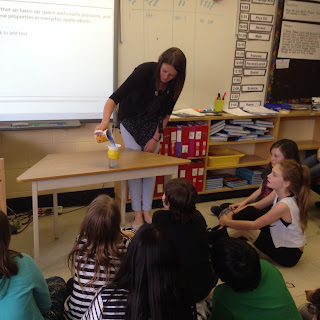
Hands-on math lessons are a great thing to encourage our learning!


